This website uses cookies. By clicking Accept, you consent to the use of cookies. Click Here to learn more about how we use cookies.
Turn on suggestions
Auto-suggest helps you quickly narrow down your search results by suggesting possible matches as you type.
Showing results for
- Extreme Networks
- Community List
- Legacy
- End of Service Products
- SIEM - custom time series charts issue
Options
- Subscribe to RSS Feed
- Mark Topic as New
- Mark Topic as Read
- Float this Topic for Current User
- Bookmark
- Subscribe
- Mute
- Printer Friendly Page
SIEM - custom time series charts issue
SIEM - custom time series charts issue
Options
- Mark as New
- Bookmark
- Subscribe
- Mute
- Subscribe to RSS Feed
- Get Direct Link
- Report Inappropriate Content
10-14-2016 06:32 AM
Hi,
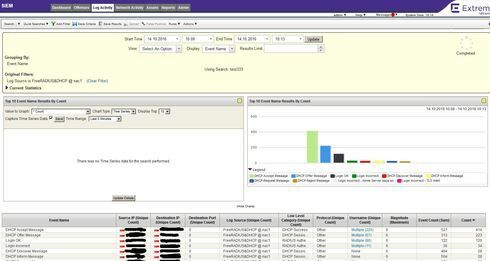
I have a problem with custom dashbords after upgrade system to latest version Build 20160816201941. I have few time series chats like full dhcp log, showing count of events, filter by 'event name' in time range like 3 or 7 days. And after upgrade every chat start to showing this info:
There was no Time Series data for the search performed.
I was trying to create new search, Capture Time Series Data is selected and saved as new, also update details aint helping.
I noticed that there is some function 'Data Accumulation Data is currently being accumulated for the search. Unique counts are disabled'. But enabling also aint helping. Trying to search something to change in admin -> aggregated data management, but also nothing happens.
Google told me that qradar got this issue, when user was login as normal user not admin. It was resolved in 7.2.6 patch 3 http://www-01.ibm.com/support/docview.wss?uid=swg1IV81141
Relogin to admin and doing everything once again failed.
Any one got same issue?
3 REPLIES 3
Options
- Mark as New
- Bookmark
- Subscribe
- Mute
- Subscribe to RSS Feed
- Get Direct Link
- Report Inappropriate Content
11-07-2016 03:50 PM
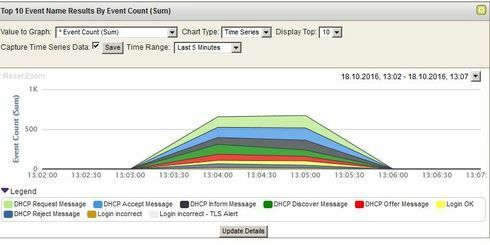
Michał, Are you still getting the correct values in the Time-Series graph when changing the value parameter to 'Event Count'?
Options
- Mark as New
- Bookmark
- Subscribe
- Mute
- Subscribe to RSS Feed
- Get Direct Link
- Report Inappropriate Content
11-07-2016 03:50 PM
yup, works fine.
Options
- Mark as New
- Bookmark
- Subscribe
- Mute
- Subscribe to RSS Feed
- Get Direct Link
- Report Inappropriate Content
10-18-2016 09:13 AM
Changing count to 'event count', helped..but are this the same values? Looks ok.


