This website uses cookies. By clicking Accept, you consent to the use of cookies. Click Here to learn more about how we use cookies.
Turn on suggestions
Auto-suggest helps you quickly narrow down your search results by suggesting possible matches as you type.
Showing results for
- Extreme Networks
- Community List
- Network Management & Authentication
- ExtremeCloud IQ- Site Engine Management Center
- Port utilization in % on uplinks using Netsight
Options
- Subscribe to RSS Feed
- Mark Topic as New
- Mark Topic as Read
- Float this Topic for Current User
- Bookmark
- Subscribe
- Mute
- Printer Friendly Page
Port utilization in % on uplinks using Netsight
Port utilization in % on uplinks using Netsight
Options
- Mark as New
- Bookmark
- Subscribe
- Mute
- Subscribe to RSS Feed
- Get Direct Link
- Report Inappropriate Content
09-09-2015 06:19 AM
I want to monitor the utilization in % on the uplinks of XOS switches. How do I do this?
In the console you can select the flexview "port utilization in percent", which is the one I need. But how do I add the ports I want to see and how do I display them in OneView?
In the console you can select the flexview "port utilization in percent", which is the one I need. But how do I add the ports I want to see and how do I display them in OneView?
4 REPLIES 4
Options
- Mark as New
- Bookmark
- Subscribe
- Mute
- Subscribe to RSS Feed
- Get Direct Link
- Report Inappropriate Content
09-10-2015 08:28 AM
Great! This is exactly what I was looking for! I will check it out later but I guess this is the solution.
Options
- Mark as New
- Bookmark
- Subscribe
- Mute
- Subscribe to RSS Feed
- Get Direct Link
- Report Inappropriate Content
09-10-2015 08:28 AM
Definitely let us know if you have any issues
Options
- Mark as New
- Bookmark
- Subscribe
- Mute
- Subscribe to RSS Feed
- Get Direct Link
- Report Inappropriate Content
09-10-2015 08:28 AM
Welcome to the Hub Ramon. That's how this community rolls!
You'll find lots of knowledge sharing, purple passion and speedy responses.
Appreciate you joining us.
You'll find lots of knowledge sharing, purple passion and speedy responses.
Appreciate you joining us.
Options
- Mark as New
- Bookmark
- Subscribe
- Mute
- Subscribe to RSS Feed
- Get Direct Link
- Report Inappropriate Content
09-09-2015 12:31 PM
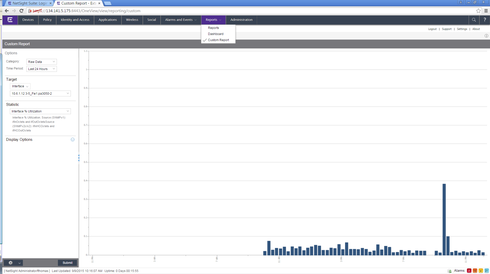
Hi,Have you tried custom reports, under reports?
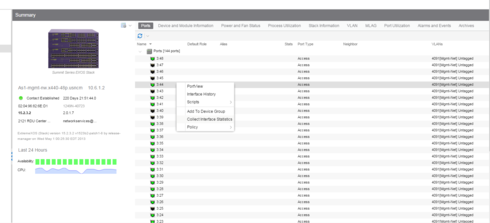
Select a switch, collect interface statistics
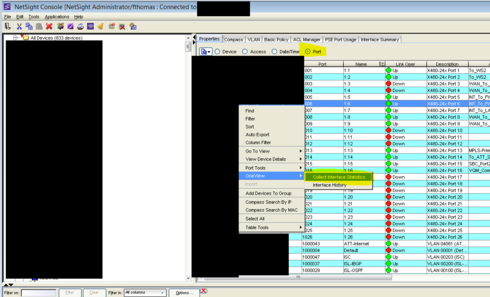
Alternatively you can collect interface stats from console [May have to depending of version of Netsight running 6.1 vs 6.2 vs 6.3]
After 10-15 minutes, we will have collected interface stats to start graphing.
In Oneview
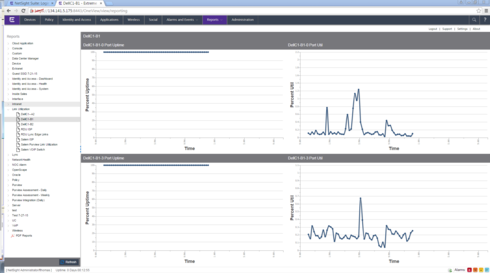
Under Custom Reports Select interfaces and choose what you want to graph %utils
Not sure if this was added in 6.2 or 6.3
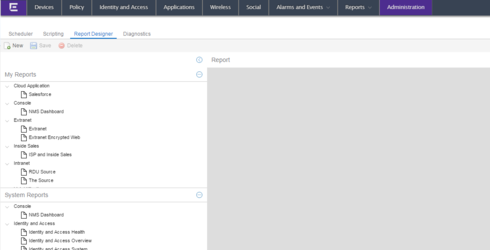
Save it report designer as an option
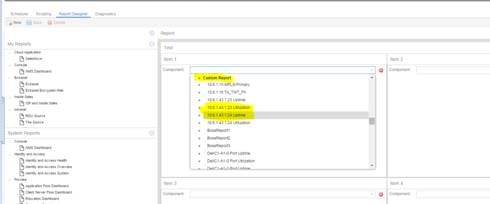
In Administration tab go to Report Designer
Pick the custom report option we created, additional elements can be created and added together as well for a single report.
Save then under reports we can then view anything we created
