- Extreme Networks
- Community List
- Network Management & Authentication
- ExtremeCloud IQ- Site Engine Management Center
- XMC reports blank, with enabled ports stats and fl...
- Subscribe to RSS Feed
- Mark Topic as New
- Mark Topic as Read
- Float this Topic for Current User
- Bookmark
- Subscribe
- Mute
- Printer Friendly Page
XMC reports blank, with enabled ports stats and flows
XMC reports blank, with enabled ports stats and flows
- Mark as New
- Bookmark
- Subscribe
- Mute
- Subscribe to RSS Feed
- Get Direct Link
- Report Inappropriate Content
05-24-2020 07:47 AM
Hi,
Running XMC 8.1.2.27, plan to upgrade at some point.
At this time there are Extreme switches, Juniper and Palo firewalls modelled.
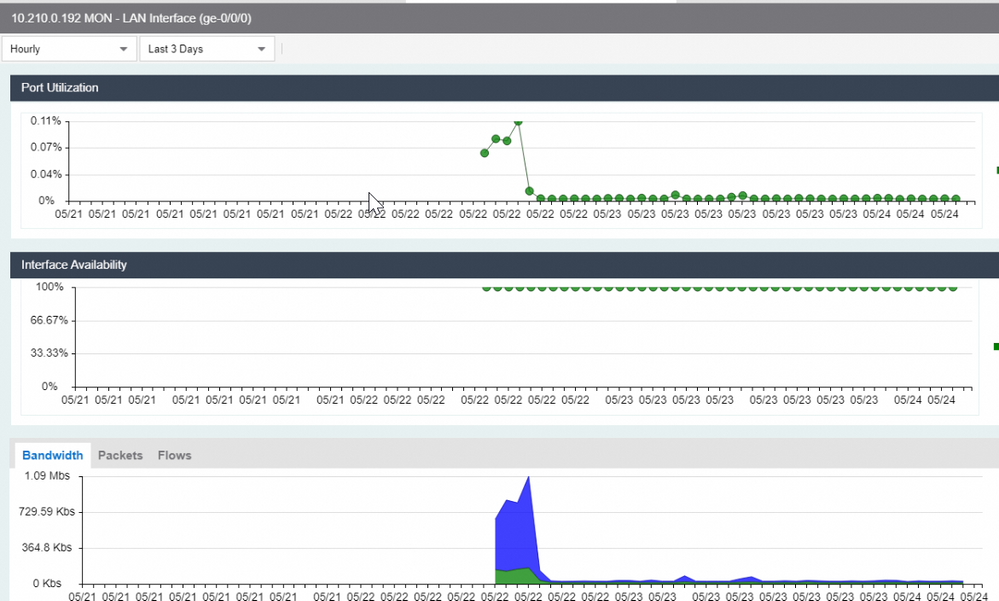
The Juniper firewalls currently only have the port stats enable and this seems to showing fine in interface history:

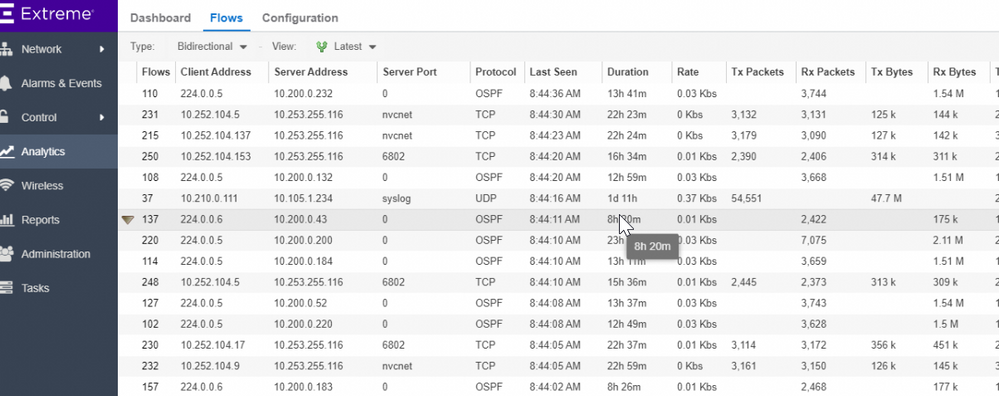
Also have one of the firewalls point Netflow directly to XMC and can see the flow data. We are currently only interested in L3-L4, top talkers. At this time L7 and response times are not required.

This issue is if you go the Analytics dashboard, or go to reports and look at Top Client, Application, Server or Top Ports by Bandwidth, Utilisation etc they are all blank.
In fact all the reports are blank yet the data is coming in, just wondering if anyone knows why?
Many thanks in advance
