This website uses cookies. By clicking Accept, you consent to the use of cookies. Click Here to learn more about how we use cookies.
Turn on suggestions
Auto-suggest helps you quickly narrow down your search results by suggesting possible matches as you type.
Showing results for
- Extreme Networks
- Community List
- Network Management & Authentication
- ExtremeCloud IQ- Site Engine Management Center
- RE: NetSight PDF reports
Options
- Subscribe to RSS Feed
- Mark Topic as New
- Mark Topic as Read
- Float this Topic for Current User
- Bookmark
- Subscribe
- Mute
- Printer Friendly Page
NetSight PDF reports
NetSight PDF reports
Options
- Mark as New
- Bookmark
- Subscribe
- Mute
- Subscribe to RSS Feed
- Get Direct Link
- Report Inappropriate Content
01-28-2016 10:59 AM
Hi.
I am looking for a pdf report where you can see utilization on some selected ports on different XOS switches.
A nice report with Graphs over a selected time would be nice.
Does enybody know if this exist today or can be build without to much programming?
I am looking for a pdf report where you can see utilization on some selected ports on different XOS switches.
A nice report with Graphs over a selected time would be nice.
Does enybody know if this exist today or can be build without to much programming?
9 REPLIES 9
Options
- Mark as New
- Bookmark
- Subscribe
- Mute
- Subscribe to RSS Feed
- Get Direct Link
- Report Inappropriate Content
02-05-2016 09:13 AM
I am using NetSight 6.3 and have tested your explanation.
It looks much better and I think this is something that I can use.
Thanks
It looks much better and I think this is something that I can use.
Thanks
Options
- Mark as New
- Bookmark
- Subscribe
- Mute
- Subscribe to RSS Feed
- Get Direct Link
- Report Inappropriate Content
02-05-2016 09:13 AM
Good luck!
Options
- Mark as New
- Bookmark
- Subscribe
- Mute
- Subscribe to RSS Feed
- Get Direct Link
- Report Inappropriate Content
02-04-2016 05:13 PM
Which version of Netsight are you using?
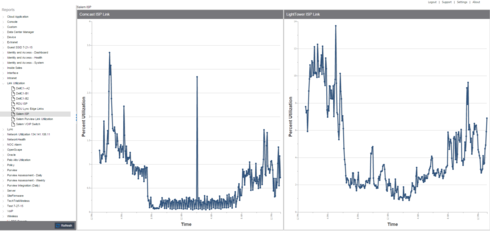
Are you looking for something like this? A couple of report of a couple of different switches and links?
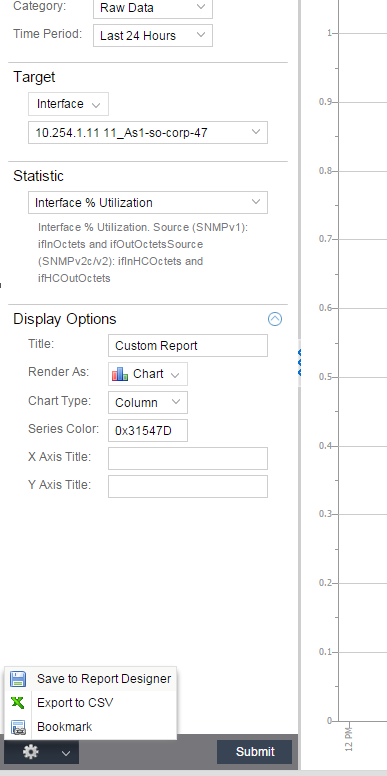
If running 6.2 or 6.3, you should be able to right change the render option from grid to chart and save to report designer. Each component saved will be accessible in the report designer.
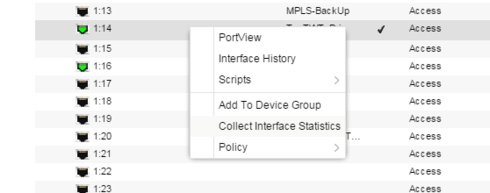
In order to graph a port, the switch/port has to collect stats on.
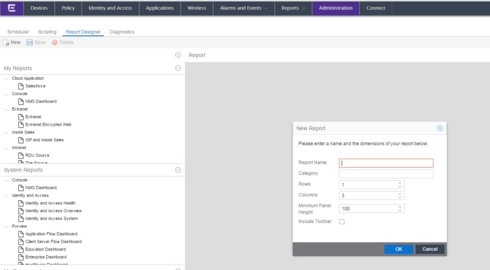
Use the report designer
Pick out the components for your report. These can come from custom reports, purview, wireless, nac etc.
Save and you can send yourself a pdf of your own report nightly/weekly/monthly.
Options
- Mark as New
- Bookmark
- Subscribe
- Mute
- Subscribe to RSS Feed
- Get Direct Link
- Report Inappropriate Content
01-29-2016 12:43 PM
If you are wanting to look at a specific group of port you can create a port group. This works just like creating a device group and would allow you to then select that group then different flexviews.
The down side is at this time OneView does not support port groups so you would only be able to view it in Console.
The down side is at this time OneView does not support port groups so you would only be able to view it in Console.


