This website uses cookies. By clicking Accept, you consent to the use of cookies. Click Here to learn more about how we use cookies.
Turn on suggestions
Auto-suggest helps you quickly narrow down your search results by suggesting possible matches as you type.
Showing results for
- Extreme Networks
- Community List
- Network Management & Authentication
- ExtremeCloud IQ- Site Engine Management Center
- Application Analytics response time graphs
Options
- Subscribe to RSS Feed
- Mark Topic as New
- Mark Topic as Read
- Float this Topic for Current User
- Bookmark
- Subscribe
- Mute
- Printer Friendly Page
Application Analytics response time graphs
Application Analytics response time graphs
Options
- Mark as New
- Bookmark
- Subscribe
- Mute
- Subscribe to RSS Feed
- Get Direct Link
- Report Inappropriate Content
10-23-2017 06:04 AM
Hi all,
I have the question regarding application analytics.
We would like to have on the NOC screen dashboard that shows network and application response time for some custom applications.
Most suitable view for the customer is this:
But, we couldn't find a way to filter this to only show, for example, data from last hour. We can't set custom time because this time period should change as time is going. Are we missing something?
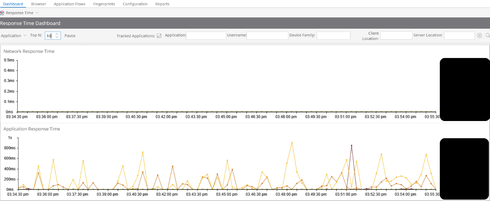
Another solution is Response time dashboard. The first issue in this view is the limitation to max 10 TOP applications (we have more than 10 apps). We could overcome this using wildcard in Application search and have 2 rotating screens. The problem is that Application field in search bar doesn’t support wildcards (in solution with the report it was possible).
Another idea was to use tracked applications. The problem here is also the limitation to max 10 applications in the dashboard.
Every idea is more than welcome!
Thank you,
best regards,
Vesna.
1 REPLY 1
Options
- Mark as New
- Bookmark
- Subscribe
- Mute
- Subscribe to RSS Feed
- Get Direct Link
- Report Inappropriate Content
01-26-2018 12:43 PM
Hi Vesna
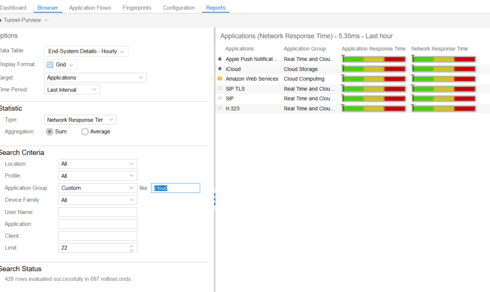
Would something like this report work for you. Note the custom group option and last interval time.
Would something like this report work for you. Note the custom group option and last interval time.


