This website uses cookies. By clicking Accept, you consent to the use of cookies. Click Here to learn more about how we use cookies.
Turn on suggestions
Auto-suggest helps you quickly narrow down your search results by suggesting possible matches as you type.
Showing results for
- Extreme Networks
- Community List
- Network Management & Authentication
- ExtremeCloud IQ- Site Engine Management Center
- RE: application telemetry best practices, telemetr...
Options
- Subscribe to RSS Feed
- Mark Topic as New
- Mark Topic as Read
- Float this Topic for Current User
- Bookmark
- Subscribe
- Mute
- Printer Friendly Page
application telemetry best practices, telemetry.pol enhanchements and some flow hints
application telemetry best practices, telemetry.pol enhanchements and some flow hints
Options
- Mark as New
- Bookmark
- Subscribe
- Mute
- Subscribe to RSS Feed
- Get Direct Link
- Report Inappropriate Content
05-14-2018 11:50 AM
Hi all
I'm trying to understand how to better use the analytics stuff ...
I have several question,
and maybe some ideas ...
first of all: APP Telemetry
I see that everything seems to work thanks to:
- sflow
- a quite big policy on the switch
- the remote EAN mirror
with a costumer, I would like to have as much information as possible with a specific traffic ...
what I did till now is:
- I decreased the sflow sampling rate to the minimum of 256 on ports where I know there are the "interesting devices"
- I modified the telemetry.pol, to mirror to the "EAN mirror" ALL the traffic "from and to" those devices
am I moving in the right direction,
or I'm doing it in a completely wrong way?
if I mirror a lot of traffic to the "EAN mirror", this will increase the amount of information that the analytics software can get from the traffic, or is it completely useless (like ... the analytics software can handle only specific traffic signatures, and NOTHING out of that ... )
second: network response time vs application response time
I see I don't have those values for ALL the flows I have ... why?
I mean ... I suppose part of the "problem" is related to sflow sampling rate ...
but what else?
limited signatures?
can I have those values for both UDP and TCP traffic?
third: core2 probe
I know that using a core2 probe, with all mirrored traffic,
I can have a lot of information about network traffic ...
but ...
is there any way to have a similar amount of information,
without the use of a core2 probe?
(I mean, also considering what I said in the previous "points")
What I don't understand is "WHY I always need a Core2 physical probe" ...
I can understand it because of "huge amount" of traffic,
but IF I need more infos about a very specific flow, or a very specific traffic,
why I can't have a "software" that is directly on the Analytics VM that can analyze that traffic ...
moreover now I have the GRE tunnel option, that is "super usefull"!! ...
please let me know what you thing
best regards
Stefano
3 REPLIES 3
Options
- Mark as New
- Bookmark
- Subscribe
- Mute
- Subscribe to RSS Feed
- Get Direct Link
- Report Inappropriate Content
05-16-2018 11:06 AM
Hi Stefano,
I think there may be a few things to consider. Regardless of CoreFlow2 or Application Telemetry, we don't always get the mirror traffic needed to support a response time, even with tcp based traffic. It looks like the majority of SIP and RTP traffic are typically using UDP as a flow and so are not picking them up.
It's also important to realize timing in some of these setups. An sflow sample will always report a payload, but if it is a not a new connection the traffic for the initial handshake may be missed, and the fingerprint may not show the correct traffic pattern.
Analytics in general is more purposed for long term reporting than it is short run flow detection. What you are looking at is the local flow collection off the Analytics appliance. Overtime it takes the important Top100 applications and Top100 users slow connections and builds reports based on that. Most of this flow data is temporary in nature, however it is useful for short term setup troubleshooting.
Options
- Mark as New
- Bookmark
- Subscribe
- Mute
- Subscribe to RSS Feed
- Get Direct Link
- Report Inappropriate Content
05-16-2018 06:40 AM
thanks a lot for the reply ... very very useful 😛
for what I understood,
with the ACL stuff on the switch I can get
- the application type
- network and response time
with sflow stuff I can get:
- bandwidth usage
- top talkers
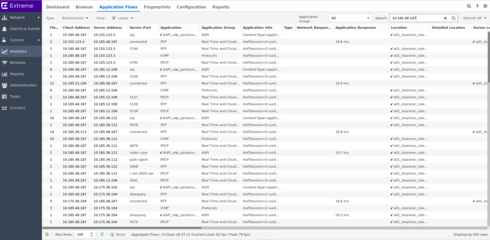
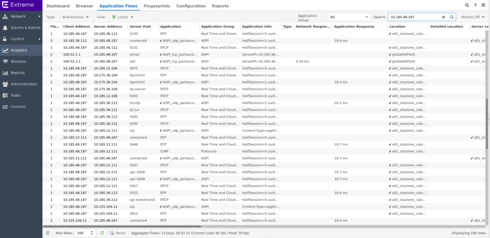
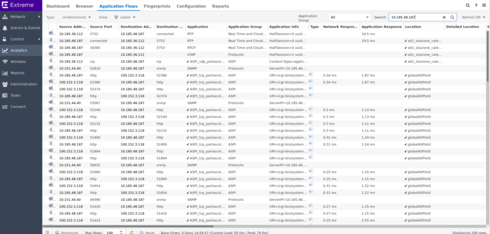
please check the below pictures
in this you can see RTP, SIP, and RTCP traffic ...
I only have the application response time of the RTP stuff ...
in this second picture,
I can see similar traffic, plus an ssh session, with only the network response time ...
in this third picture, the last one for now, I can see the unidirectional traffic for the same client,
10.185.48.187,
with a not of application and network response time for the HTTP stuff,
and some application response time for RTP
what I would like to achieve is to have as much as possible for the network response time and application response time for that client,
10.185.48.187,
whose most critical traffic is SIP
why I don't see any application response time and network response time for SIP traffic? is because of the type of the traffic? is because I'm not getting all the needed information? is because there's no way to get those parameters in the actual configuration?
and why I'm getting only some network response time OR application response time, and NOT both of them for all the flows (SSH, RTP, also HTTP sometimes)?
please let me know what you think
thanks a lot
best regards
Stefano
Options
- Mark as New
- Bookmark
- Subscribe
- Mute
- Subscribe to RSS Feed
- Get Direct Link
- Report Inappropriate Content
05-15-2018 12:41 PM
Hiall
I'm trying to understand how to better use theanalytics stuff ...
I have several question,
and maybe some ideas ...
first of all: APP Telemetry
I see that everything seems to work thanks to:
- sflow
- a quite big policy on the switch
- the remote EAN mirror
<
with a costumer, I would like to have as muchinformation as possible with a specific traffic ...
what I did till now is:
- I decreased the sflow sampling rate to theminimum of 256 on ports where I know there are the "interestingdevices"
<
- I modified the telemetry.pol, to mirror to the"EAN mirror" ALL the traffic "from and to" those devices
<
am I moving in the right direction,
or I'm doing it in a completely wrong way?
if I mirror a lot of traffic to the "EANmirror", this will increase the amount of information that the analyticssoftware can get from the traffic, or is it completely useless (like ... theanalytics software can handle only specific traffic signatures, and NOTHING outof that ... )
<
second: network response time vs applicationresponse time
I see I don't have those values for ALL theflows I have ... why?
<
I mean ... I suppose part of the"problem" is related to sflow sampling rate ...
but what else?
limited signatures?
can I have those values for both UDP and TCPtraffic?
<
third: core2 probe
I know that using a core2 probe, with allmirrored traffic,
I can have a lot of information about networktraffic ...
<
but ...
is there any way to have a similar amount ofinformation,
without the use of a core2 probe?
<
(I mean, also considering what I said in theprevious "points")
What I don't understand is "WHY I alwaysneed a Core2 physical probe" ...
<
I can understand it because of "hugeamount" of traffic,
but IF I need more infos about a very specificflow, or a very specific traffic,
why I can't have a "software" that isdirectly on the Analytics VM that can analyze that traffic ...
<
moreover now I have the GRE tunnel option, thatis "super usefull"!! ...
<


