- Extreme Networks
- Community List
- Network Management & Authentication
- ExtremeCloud IQ- Site Engine Management Center
- Re: Interface history rx an tx errors
- Subscribe to RSS Feed
- Mark Topic as New
- Mark Topic as Read
- Float this Topic for Current User
- Bookmark
- Subscribe
- Mute
- Printer Friendly Page
Interface history rx an tx errors
- Mark as New
- Bookmark
- Subscribe
- Mute
- Subscribe to RSS Feed
- Get Direct Link
- Report Inappropriate Content
02-05-2024 06:30 AM
I've enabled 'collect port statistics' on ports of my switch.
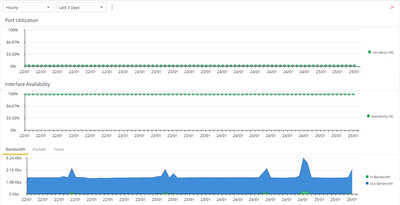
When I select interface history I can only see port Utilization, availability and bandwitch
I want also see af graph of errors (rx, collinsions ect).
Is this possible?
Solved! Go to Solution.
- Mark as New
- Bookmark
- Subscribe
- Mute
- Subscribe to RSS Feed
- Get Direct Link
- Report Inappropriate Content
02-16-2024 07:00 AM
Understood. Related to this topic I have come to discover certain devices do not support standard RFC IF-MIB counters for common errors and report them via vendor-specific MIBs which the default views above do not show... It would be possible to create a custom FlexView on the vendor specific OIDs to report more granular data like congestion, drops, etc.
- Mark as New
- Bookmark
- Subscribe
- Mute
- Subscribe to RSS Feed
- Get Direct Link
- Report Inappropriate Content
02-15-2024 11:30 PM - edited 02-15-2024 11:30 PM
I can only see that there are errors. I can't see what kind of errors .
- Mark as New
- Bookmark
- Subscribe
- Mute
- Subscribe to RSS Feed
- Get Direct Link
- Report Inappropriate Content
02-16-2024 07:00 AM
Understood. Related to this topic I have come to discover certain devices do not support standard RFC IF-MIB counters for common errors and report them via vendor-specific MIBs which the default views above do not show... It would be possible to create a custom FlexView on the vendor specific OIDs to report more granular data like congestion, drops, etc.
- Mark as New
- Bookmark
- Subscribe
- Mute
- Subscribe to RSS Feed
- Get Direct Link
- Report Inappropriate Content
02-06-2024 05:48 AM
The Interface History has a Packets tab (see bottom graph Bandwidth / Packets / Flows) so if you select Packets that will be a simple graph of valid vs error. If you are looking for something more granular it may be possible to create your own FlexView or report but I am not certain of that.

