This website uses cookies. By clicking Accept, you consent to the use of cookies. Click Here to learn more about how we use cookies.
Turn on suggestions
Auto-suggest helps you quickly narrow down your search results by suggesting possible matches as you type.
Showing results for
- Extreme Networks
- Community List
- Network Management & Authentication
- ExtremeCloud IQ- Site Engine Management Center
- Oneview top interfaces reports
Options
- Subscribe to RSS Feed
- Mark Topic as New
- Mark Topic as Read
- Float this Topic for Current User
- Bookmark
- Subscribe
- Mute
- Printer Friendly Page
Oneview top interfaces reports
Oneview top interfaces reports
Options
- Mark as New
- Bookmark
- Subscribe
- Mute
- Subscribe to RSS Feed
- Get Direct Link
- Report Inappropriate Content
09-17-2015 06:17 AM
Hi community
I am look for some advice on the interface reports in oneview.
In my Netsight (6.3) I have over 100 S series switches (Various S8,S6 and SSA's)
In one view I can generate custom reports for each infividual interface on every device/port.
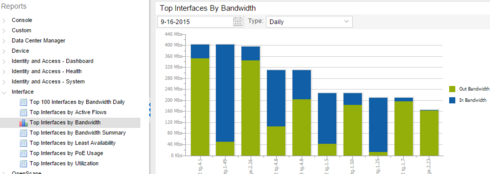
If I look at the predefined reports under "Reports", we find "Interface Reports" and then we find "Top interfaces by Bandwidth".
The reports looks as follows:
The problem I have is that this reports is across all 100 switches.
I am looking for the same report but for a individual device.
I would like to see the top 10 ports on a specific S series switch.
How do you generate the same report but on a per device basis?
Regards
7 REPLIES 7
Options
- Mark as New
- Bookmark
- Subscribe
- Mute
- Subscribe to RSS Feed
- Get Direct Link
- Report Inappropriate Content
10-02-2015 12:13 PM
Just a sanity check as well.
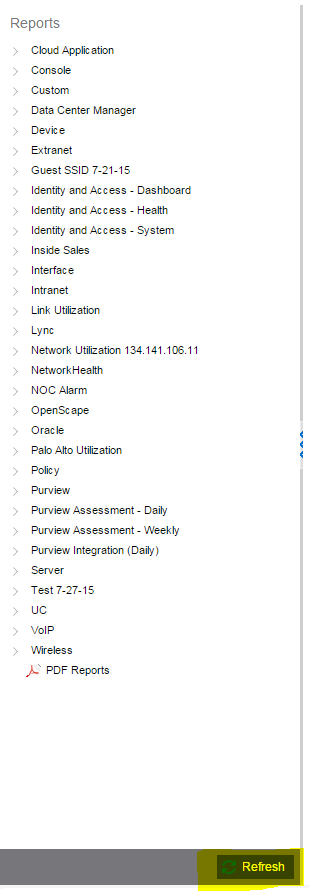
You did refresh the tree correct? This reloads the tree with everything from the reports and myreports directory
You did refresh the tree correct? This reloads the tree with everything from the reports and myreports directory
Options
- Mark as New
- Bookmark
- Subscribe
- Mute
- Subscribe to RSS Feed
- Get Direct Link
- Report Inappropriate Content
09-30-2015 05:54 PM
Correct,
The first 3 are for the report itself, having duplicate report ids is a bad thing. You could have the title and category be whatever you like.
Anyways the in regards to the sql query.
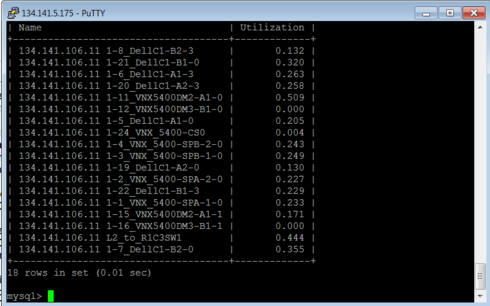
You can try it yourself on the netsight server.
1.) /usr/local/Extreme_Networks/NetSight/scripts$ ./mysql.sh
you'll now be in the sql interface.
2.) Enter the following
SELECT t.displayName AS Name, (truncate(r.val ,3)) AS Utilization
FROM netsightrpt.rpt_default_raw r LEFT OUTER JOIN netsightrpt.rpt_target t
ON r.targetID=t.targetID WHERE r.statisticID=(
SELECT statisticID FROM netsightrpt.rpt_statistic WHERE name="ifUtilization")
AND time_stamp > UNIX_TIMESTAMP(NOW() - INTERVAL 20 MINUTE) * 1000;
This will output 100 stat variables similar to default report.
3.) Add the filter for one of the switches you desire
SELECT t.displayName AS Name, (truncate(r.val ,3)) AS Utilization
FROM netsightrpt.rpt_default_raw r LEFT OUTER JOIN netsightrpt.rpt_target t
ON r.targetID=t.targetID WHERE r.statisticID=(
SELECT statisticID FROM netsightrpt.rpt_statistic WHERE name="ifUtilization")
AND time_stamp > UNIX_TIMESTAMP(NOW() - INTERVAL 20 MINUTE) * 1000 and t.displayName like '%134.141.106.11%' ;
Basically, what we're taking is the t.displayName and filtering the output to a particular IP at that point. My example it would be '%134.141.106.11%'
Options
- Mark as New
- Bookmark
- Subscribe
- Mute
- Subscribe to RSS Feed
- Get Direct Link
- Report Inappropriate Content
09-30-2015 01:49 PM
Hi Thomas
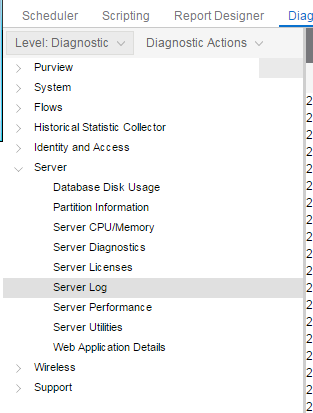
I see no errors in the Server log regarding the report.
As mentioned I know very little about MYSQL but looking at the template you only refer to 4 locations with X.X.X.X that I substitute with the device IP:
Network Utilization X.X.X.X
Network Utilization X.X.X.X
Network Utilization X.X.X.X
As far as I can read the above three lines refer to the naming convention of the report and does not actually refer to the device.
AND time_stamp > UNIX_TIMESTAMP(NOW() - INTERVAL 20 MINUTE) * 1000 and t.displayName like '%X.X.X.X%'
Then the the above is a reference to another display name.
I have changed all 4 x.x.x.x to the switch IP but see no report
Should their not be a reference to something like ip=192.168.x.x?
Regards
I see no errors in the Server log regarding the report.
As mentioned I know very little about MYSQL but looking at the template you only refer to 4 locations with X.X.X.X that I substitute with the device IP:
As far as I can read the above three lines refer to the naming convention of the report and does not actually refer to the device.
AND time_stamp > UNIX_TIMESTAMP(NOW() - INTERVAL 20 MINUTE) * 1000 and t.displayName like '%X.X.X.X%'
Then the the above is a reference to another display name.
I have changed all 4 x.x.x.x to the switch IP but see no report
Should their not be a reference to something like ip=192.168.x.x?
Regards
Options
- Mark as New
- Bookmark
- Subscribe
- Mute
- Subscribe to RSS Feed
- Get Direct Link
- Report Inappropriate Content
09-30-2015 11:50 AM
My first guess would be to double check where the file was dropped on the server, and refresh the tree (report tree must be refreshed for new reports to show up.
Second would guess there is an error. Any errors in the server log? In the admin panel under diagnostics. If there was an error in the report, it'll show which line it failed on.
Second would guess there is an error. Any errors in the server log? In the admin panel under diagnostics. If there was an error in the report, it'll show which line it failed on.


