This website uses cookies. By clicking Accept, you consent to the use of cookies. Click Here to learn more about how we use cookies.
Turn on suggestions
Auto-suggest helps you quickly narrow down your search results by suggesting possible matches as you type.
Showing results for
- Extreme Networks
- Community List
- Network Management & Authentication
- ExtremeCloud IQ- Site Engine Management Center
- NetFlow showing impossible flows
Options
- Subscribe to RSS Feed
- Mark Topic as New
- Mark Topic as Read
- Float this Topic for Current User
- Bookmark
- Subscribe
- Mute
- Printer Friendly Page
NetFlow showing impossible flows
NetFlow showing impossible flows
Options
- Mark as New
- Bookmark
- Subscribe
- Mute
- Subscribe to RSS Feed
- Get Direct Link
- Report Inappropriate Content
08-01-2016 02:12 PM
Good morning, everyone. Last week, I configured one of our FortiGate 100D firewalls to send NetFlow datagrams to my new Management Center server. I began seeing data immediately. However, I'm receiving reports of impossible flows:
I sorted the flows in descending order of TX and RX Bytes in those two images, respectively.
It's just not a possible amount of traffic. This isn't the first time I've encountered these crazy NetFlow statistics with Management Center, though. Last year, at a different organization, I was testing the feasibility of using Management Center to manage a Cisco network (it isn't very feasible, by the way), and I encountered similar impossible flows when I enabled reporting our our Cisco Catalyst 6513.
My evaluation license in Management Center expired before I discovered the source of those impossible flows.
The situation at my organization now is that we have fielded Summit X440 switches at remote locations, which are using FortiGate 100D firewalls as their gateways. From a flow monitoring perspective of network management, it makes sense to collect the flow data from the firewalls (which are capable of NetFlow v9, required by Management Center). The X440 switches are not able to report Netflow, and Management Center is unable to collect sFlow (which the X440 switches can report).
I've asked the Fortinet community about the possibility of filtering the NetFlow datagrams at the source, although their user community seems to be largely a ghost town.
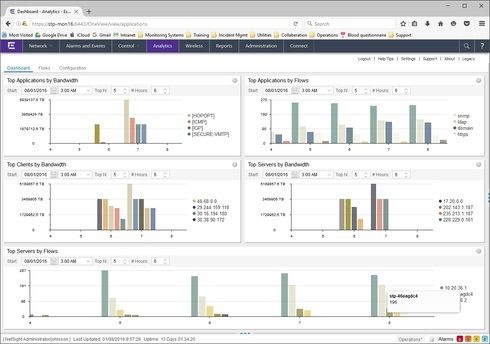
Is it possible for me to ignore these flows at the Management Center? They are making half of the Analytics dashboard useless, by filling panes that sort by bandwidth with noise:
Any dashboard pane that reports TopN of anything by bandwidth shows those impossible flows, masking anything of use to me about our networks.
How to make Management Center report on flows only concerning our networks? Or, how to make it ignore that noise? Those are the problems I need to solve to make NetSight Analytics of any use to us.
21 REPLIES 21
Options
- Mark as New
- Bookmark
- Subscribe
- Mute
- Subscribe to RSS Feed
- Get Direct Link
- Report Inappropriate Content
08-16-2016 03:47 PM
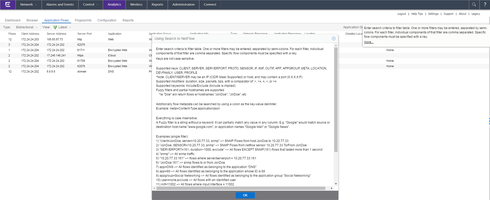
Hover over the search field with the mouse pointer till the info field show and click on "more" to get the options and examples....
Options
- Mark as New
- Bookmark
- Subscribe
- Mute
- Subscribe to RSS Feed
- Get Direct Link
- Report Inappropriate Content
08-15-2016 09:18 PM
Still having this problem. Can anyone point me to the syntax to use in the Administration > Options > NetFlow Collection > Advanced > Flow Collector Filter field?
I did a packet capture of all exports over a period of several hours, which bracketed some of the wildly impossible reports displayed in the Analytics Dashboard. No instances of any identifying piece of the offending dashboard graphs existed in that packet capture file.
This lends support to the suspicion that it is Extreme Management Center that is making the error.
However, if I can find out how to complete that filtering field, I can pare the NetFlow exports down to only those that describe traffic to or from my specific IP networks.
Options
- Mark as New
- Bookmark
- Subscribe
- Mute
- Subscribe to RSS Feed
- Get Direct Link
- Report Inappropriate Content
08-01-2016 08:26 PM
I met following behavior with Fortigate:
the Fortigate does cache netflow records. if the netflow destination is unreachable all records are cached. when the netflow destination is available again, you can get aggregated data.
can that explain your observation?
the Fortigate does cache netflow records. if the netflow destination is unreachable all records are cached. when the netflow destination is available again, you can get aggregated data.
can that explain your observation?
Regards
Zdeněk Pala
Options
- Mark as New
- Bookmark
- Subscribe
- Mute
- Subscribe to RSS Feed
- Get Direct Link
- Report Inappropriate Content
08-01-2016 08:26 PM
Hello Jesse,
I suspect that some of the NetFlow packets use a format not supported by Extreme Management Center, but instead of dropping or ignoring them, EMC interprets them as the impossible flows you see.
Asking GTAC to take a look at this seems like a good idea. 🙂
Erik
I suspect that some of the NetFlow packets use a format not supported by Extreme Management Center, but instead of dropping or ignoring them, EMC interprets them as the impossible flows you see.
Asking GTAC to take a look at this seems like a good idea. 🙂
Erik


