- Extreme Networks
- Community List
- Switching & Routing
- ExtremeSwitching (EOS)
- RE: SecureStack A4H124-48 network problem
- Subscribe to RSS Feed
- Mark Topic as New
- Mark Topic as Read
- Float this Topic for Current User
- Bookmark
- Subscribe
- Mute
- Printer Friendly Page
SecureStack A4H124-48 network problem
SecureStack A4H124-48 network problem
- Mark as New
- Bookmark
- Subscribe
- Mute
- Subscribe to RSS Feed
- Get Direct Link
- Report Inappropriate Content
10-21-2015 04:39 AM
Hi,
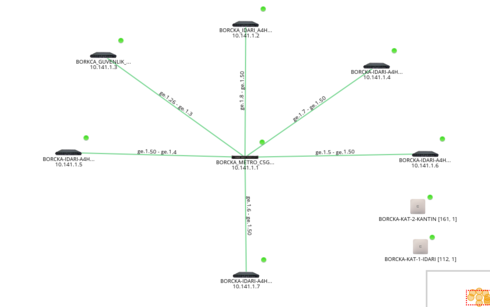
I am trying to find the cause of a network problem in one of our buildings. We have one C5 and 6 A4-48 port switches there. C5 is set as router and all A4s are access switches and connected to C5 directly.
The problem is; on 4 of the A4 switches there is very high packet lost when I ping them. Also the clients connected to these switches can't connect to internet because of high packet lost and high latencey. When I ping the switch from an other building it shows ~50000 ms and ~%20-30 packet lost. If I disable all access ports on that switch ping times drop to 1-2 ms instantly. When I enable them the problem reappears.
I looked the logs on the switch and only saw 1-2 messages that should be abnormal:
TXQMONITO[217085048]: txq_monitor.c(507) 2097 This is from manager 1 %% Tx queue for interface ge.1.50 is in stalled mode
ge.1.50 is the uplink port to C5. So I found this KB entry: https://extremeportal.force.com/ExtrArticleDetail?an=000077973
And I disabled the flowcontrol as it suggests. So the problem seems resolved.
So why we encountered this problem? There is only 4-5 active clients per switch. And why we only saw this problem on the 4 of them but not all 6 A4H? Any one have an idea? We have over 30 A4H deployed and we never saw any problem like this?
- Mark as New
- Bookmark
- Subscribe
- Mute
- Subscribe to RSS Feed
- Get Direct Link
- Report Inappropriate Content
10-22-2015 02:35 PM
Yes, any device may send an unusually large number of Pause frames to its attached peer device. And, to make things more interesting, frequently upon reboot of such a device all is well - for awhile - until it starts up again later.
You may already have determined that the Pause count statistics only have meaning when assessed against the uptime of the unit in question. Typically for the most-affected port(s) I calculate down to Rx Pause frames received per second, averaged over the uptime period. What's the actionable limit? Hard to say. One received Pause frame per second on a given port over an extended period of time would likely be affecting the equipment in some undesirable way. As seen in your case, such activity on one port has the potential to affect multiple switches in a flowcontrol domain. This is a good thing to be aware of, whenever a complaint of poor performance arises. [Consider that to be a suggested Note to Self!]
- Mark as New
- Bookmark
- Subscribe
- Mute
- Subscribe to RSS Feed
- Get Direct Link
- Report Inappropriate Content
10-22-2015 09:39 AM
- Mark as New
- Bookmark
- Subscribe
- Mute
- Subscribe to RSS Feed
- Get Direct Link
- Report Inappropriate Content
10-22-2015 08:03 AM
I am trying to find the real culprit. I enabled flow control on all switches again. And instanly on switches 10.141.1.4/10.141.1.5/10.141.1.6/10.141.1.7 the problem reappears.
The weird thing is on 10.141.1.4 switch, there are rx pause values on an access port:
fe.1.37 0 21320
ge.1.50 65858 0
fe.1.37 is an access port that suppoed to be connected to client device. ge.1.50 is the uplink to c5.
On 10.141.1.7 there is also one of client port has tx value:
fe.1.48 158 0
ge.1.50 0 3738
So is it normal to receive flow control packets on a client access port? The building is 25 km away from us. I want to find the culprit before going for onsite troubleshoot.
Thanks.
Ps: here is network topology:
- Mark as New
- Bookmark
- Subscribe
- Mute
- Subscribe to RSS Feed
- Get Direct Link
- Report Inappropriate Content
10-21-2015 04:58 PM
Because of that "precise timing" element; it is possible that the txqmonitor feature will kick in to diminish any overall negative effect before anything is noticed by network users, and it is equally possible that network latency could result without txqmonitor being triggered to intervene. Note that though txqmonitor settings can be tuned, I haven't found great value in doing that.
As to why it's happening in the first place; the output of a '
show port flowcontrol
show txqmonitor flowcontrol
set flowcontrol disable

